
Figuring out the stock market can seem complex, but technical indicators help in reading price movements and market behavior. Whether you’re trading intraday or holding long-term positions, indicators like RSI, MACD, and Moving Averages can help you spot trends, time your entries, and avoid common pitfalls. In this article, we’ll explain the most widely used stock market indicators in simple terms—perfect for beginners looking to trade smarter, not harder.
If you’re just starting and want to learn the basics step by step, check out the Stock Market Course by Diston — it’s designed to simplify these concepts for learners at all levels. In this article, we’ll break down the top 10 indicators used in technical analysis.
What are Indicators in Stock Market?
Stock market indicators are tools that help traders and investors study market trends, help in guessing future price moves, and make smart decisions. They are usually based on things like price and volume.
What are the types of Indicators in Stock Market?
There are two main types:
- Technical Indicators – These are based on price charts and trading volume. Examples include:
- Moving Averages – Show the average price over a period to smooth out trends.
- RSI (Relative Strength Index) – Measures the speed and change of price movements to identify overbought or oversold conditions.
- MACD (Moving Average Convergence Divergence) – Helps identify momentum and trend changes.
- Fundamental Indicators – These reflect the health of the overall economy or individual companies. Examples include:
- GDP Growth Rate
- Inflation & Interest Rates
- Earnings per Share (EPS)
- Price-to-Earnings (P/E) Ratio
Think of stock market indicators as “warning lights” or “guiding signs” on a highway, they don’t guarantee the outcome but help you navigate the market more wisely.
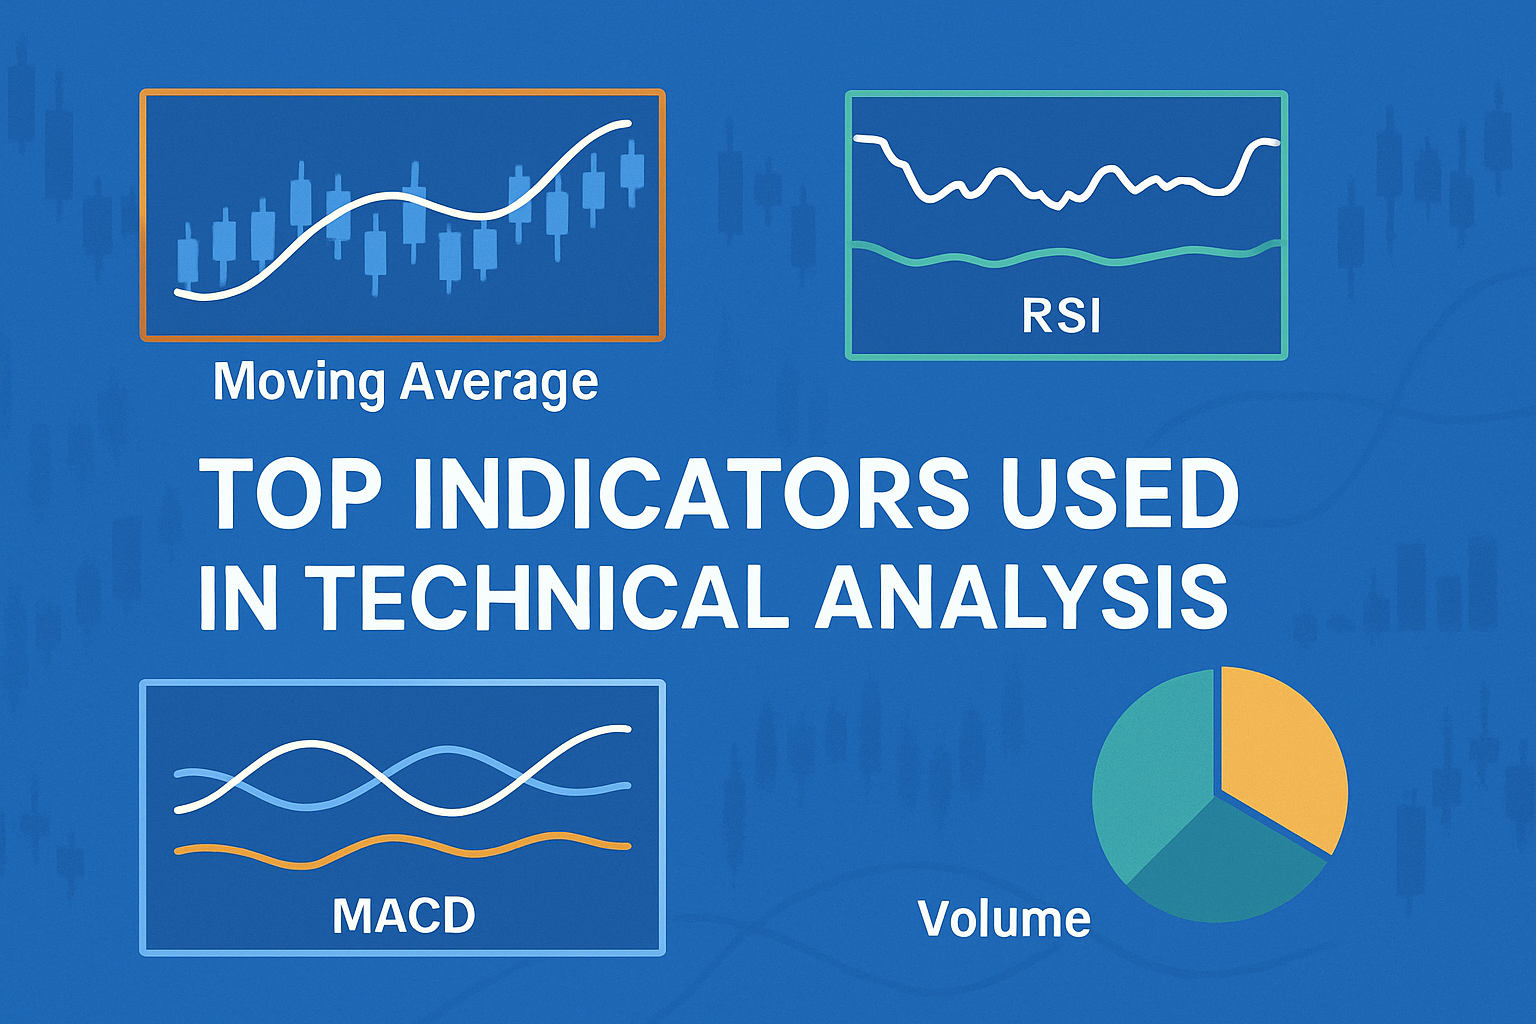
10 Top Indicators Used in Technical Analysis
The market moves in patterns, and technical analysis is the key to spotting them. Technical indicators can help you understand price trends, entry and exit points, and overall market behavior. Here is the list of top 10 indicators :
1. Moving Averages (MA)
It is a stock market indicator that smooths out price data to help you understand the overall trend of a stock over time.
What it tells you: Shows the average price of a stock over a certain number of days (like 50 or 200 days). Then you can see if the price is generally going up, down, or staying flat.
Why traders care: Helps you see the overall trend, whether it’s heading up or down. Almost every trader uses it to identify trend direction and potential reversal points.
2. Relative Strength Index (RSI)
RSI stands for Relative Strength Index. It’s a momentum indicator used in technical analysis to measure how fast and how much the price of a stock has moved in recent days.
What it tells you: RSI helps you know whether a stock is overbought (price may drop soon) or oversold (price may rise soon).
Why traders care: It helps traders spot when a stock might be overbought or oversold, signaling a possible price reversal.
3. Moving Average Convergence Divergence(MACD )
MACD stands for Moving Average Convergence Divergence, a trend-following momentum indicator that shows the relationship between two moving averages of a stock’s price.
What it tells you: It helps identify trend direction, strength of the momentum, and potential buy or sell signals.
Why traders care: It helps traders spot trend changes and momentum shifts, making it easier to time entries and exits.
4. Bollinger Bands
Bollinger Bands are a technical indicator that helps measure market volatility and identify overbought or oversold conditions. They consist of three lines: a middle moving average and two outer bands that expand and contract based on price fluctuations.
What it tells you: When the bands widen, it signals high volatility; when they tighten, it indicates low volatility.
Why traders care: They help traders spot potential breakouts or reversals based on how far the price moves from its average.
5. Volume
Volume in the stock market refers to the total number of shares traded during a specific time period. It shows how actively a stock is being bought and sold.
What it tells you: High volume means strong interest and participation, while low volume indicates less activity.
Why traders care: It confirms the strength of a price move; strong trends usually happen with high volume, making the move more reliable.
6. Stochastic Oscillator
The Stochastic Oscillator is a momentum indicator that compares a stock’s closing price to its price range over a certain period, usually 14 days.
What it tells you: It moves between 0 and 100 and helps identify overbought and oversold conditions. If the readings are above 80it suggests a stock may be overbought, while below 20 suggests it may be oversold.
Why traders care: It helps traders spot possible price reversals and time their entries or exits more accurately.
7. Fibonacci Retracement
Fibonacci Retracement is a technical analysis tool that helps identify possible support and resistance levels during a price pullback.
What it tells you: Traders use these levels to predict where a stock might pause or reverse.
Why traders care: It matters because it helps spot potential entry or exit points during trending markets by highlighting where price corrections might end.
8. Average True Range (ATR)
Average True Range is a technical indicator that measures market volatility, means how much a stock moves, on average, during a certain period.
What it tells you: It just tells you how much the price is moving overall.
Why traders care: It helps traders set better stop-loss levels and understand the risk involved in a trade.
9. Parabolic SAR (Stop and Reverse)
It s a trend-following indicator that helps identify where a trend might change direction.
What it tells you: It when a stock’s trend might change, helping you decide the best time to buy or sell.
Why traders care: It matters because it helps traders know when to enter or exit a trade based on trend shifts.
10. On-Balance Volume (OBV)
It is a technical indicator that uses trading volume to predict price movements.
What it tells you: It shows if more people are buying or selling a stock by tracking volume changes along with price.
Why does it matter: It helps confirm trends and signals if a price move is backed by strong buying or selling pressure.
Amazing Facts About Stock Market Indicators
- They’re Not Always Right — But Still Powerful
Many assume indicators predict the market with certainty. In truth, they increase probability, not guarantee outcomes. Even top traders use them as guides, not gospel. - Most Indicators Are Based on Just Price & Volume
Despite sounding complex, the majority of technical indicators (MACD, RSI, Bollinger Bands, etc.) are just mathematical transformations of price and volume data. - You Don’t Need to Use All of Them
More indicators ≠ better results. In fact, using too many can lead to “analysis paralysis.” Often, just 2–3 well-understood indicators work better than a cluttered screen. - Some Work Best in Specific Market Conditions
- RSI and Stochastic are better in sideways/choppy markets.
- Moving Averages and MACD shine in trending markets.
Knowing when to use what is more important than the indicator itself.
- Many Successful Traders Use Custom Indicators
Professionals often tweak or create their own versions of popular indicators, tailoring them to their strategy or market (like intraday, swing, or long-term). - They Were Invented Decades Ago — And Still Work
Indicators like RSI (1978), MACD (1970s), and Bollinger Bands (1980s) were created before modern computers — yet they remain widely used and effective today. - Indicators Reflect Human Behavior
Behind every chart is human psychology — fear, greed, hope. Indicators simply quantify patterns in emotions, which tend to repeat over time. - Volume-Based Indicators Are Often Overlooked
While everyone watches price, volume reveals the strength behind a move. Tools like OBV (On-Balance Volume) or Accumulation/Distribution can spot smart money moves early. - One Indicator Can Tell Multiple Stories
Example: Moving Average can be used for trend direction, support/resistance, or entry/exit. It’s all about how you interpret it. - Many Traders Use Indicators Without Truly Understanding Them
Clicking on indicators is easy. But few dig deep into how they’re calculated, when they work best, or their limitations. Mastering one can be more valuable than knowing ten.
Conclusion
Understanding technical indicators doesn’t have to be complicated. Once you learn what each one does and how it works, they become powerful tools to help you read the market more confidently. Whether you’re just starting out or looking to improve your strategy, these 10 indicators can guide your decisions and reduce guesswork. Remember, indicators are not magic. They simply help you see patterns and possibilities more clearly. The key is to use them wisely, not blindly, and always keep learning.